Smartphone Market Share by Brand: Global Rankings and Enterprise Implications
Apple and Samsung dominate the global smartphone market, with their combined shipment share reaching 39% in 2025 and continuing to widen their lead in 2026. This article breaks down the smartphone market share by brand using the latest data from IDC, Counterpoint, and StatCounter, and explains what these shifting volumes mean for business leaders managing enterprise device fleets and procurement strategies.
What is the current smartphone market share by brand?
To understand the market, it is necessary to distinguish between shipment share (devices sold to consumers) and usage share (the active installed base). The following table synthesizes the most recent verified data across these metrics.
| Brand | Metric | Figure | Period / Year | Source |
|---|---|---|---|---|
| Apple | Global Usage Share | 30.65% | Sept 2025 – Sept 2026 | StatCounter |
| Samsung | Global Usage Share | 23.47% | Sept 2025 – Sept 2026 | StatCounter |
| Apple & Samsung | Combined Global Shipment Share | 39% | Full Year 2025 | IDC |
| Samsung | Global Shipment Share | 19% | Q3 2025 | Counterpoint |
| Xiaomi | Global Shipment Share | 14% | Q3 2025 | Counterpoint |
| Apple | US Market Share | 55.91% | 2025 / 2026 | BankMyCell |
| Samsung | US Market Share | 29.87% | 2025 / 2026 | BankMyCell |
Apple holds the largest active installed base globally, while Samsung remains a close second in both usage and quarterly shipments. However, the most significant trend for business observers is the consolidation of shipment volume at the very top of the market. Apple and Samsung’s combined share expanded to 39% in 2025, up from 37% the previous year.
How did the top vendors perform in the latest quarters?
The global smartphone market reached a total of 1.26 billion units shipped in 2025. In the fourth quarter of that year, global shipments increased 2.3% year-over-year to 336.3 million units. Apple and Samsung were the primary growth drivers, posting growth rates of 6.3% and 7.9% respectively among the Top 5 vendors.
However, the market dynamics shifted sharply in 2026. According to final historical data from the IDC Worldwide Quarterly Mobile Phone Tracker, the global market shrank 7.4% year-on-year to 276.3 million units in the second quarter of 2026. This decline was driven by a severe memory crisis that disrupted supply chains and inflated component costs.
Despite the overall market contraction, premium vendors demonstrated resilience. Apple and Samsung were the “only two vendors in the Top 5 posting growth” in Q2 2026.
Nabila Popal, senior research director for Worldwide Consumer Devices at IDC, explained the structural disadvantage facing budget vendors: “Memory costs are up nearly 300% from a year ago, and now account for over 65% of BOM at the low end, making survival increasingly difficult for OEMs with low-end portfolios.”
Consequently, the rankings for Xiaomi, OPPO, and vivo remained unchanged, but the pace of decline accelerated among Chinese vendors, with most large players falling by double digits year-over-year. Huawei stood apart in this environment, posting 19.9% year-over-year growth by holding prices steady in China.
What is the operating system market share globally?
AI illustration · Tech World News
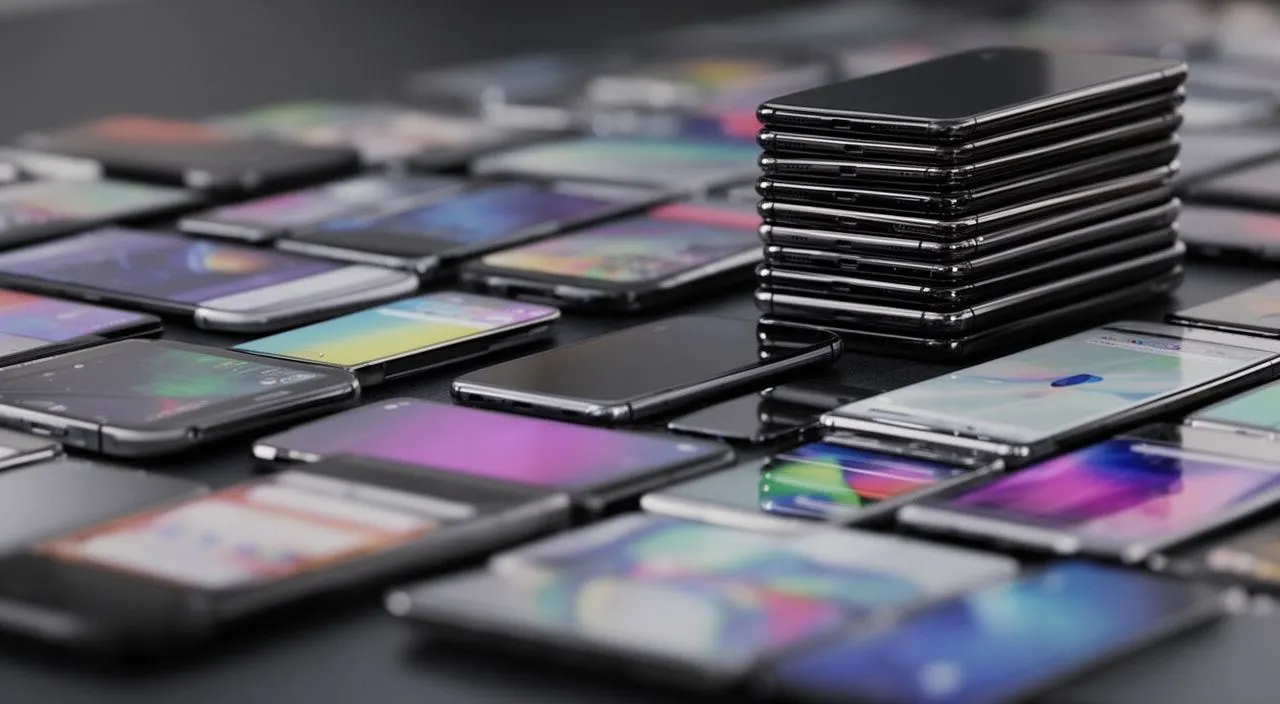
Brand market share is inextricably linked to operating system dominance. The global market remains heavily skewed toward Android, though iOS maintains a highly lucrative premium segment.
According to Market Data Forecast, Android “dominated the market by capturing 73.5% of global share” in 2025. Persistence Market Research places the Android share slightly lower, estimating it at approximately 71% global market share in 2025. iOS captures the remainder, driven almost entirely by Apple’s hardware sales.
This OS divide is fundamentally a divide between open and closed architectures. Android’s open-source model enables adoption across diverse price segments and manufacturer flexibility, which is why it dominates in emerging markets and the mid-range sector. iOS, conversely, is restricted to Apple’s hardware, concentrating its market share in regions with higher average selling prices and premium device adoption.
Distribution channels also reflect these OS dynamics. Retailers accounted for the largest distribution channel share at 47.1%, but e-commerce is anticipated to register the fastest growth, with a projected CAGR of 12.2% through 2034. This shift toward online procurement is particularly relevant for enterprise IT teams purchasing device fleets directly from manufacturers or authorized online enterprise portals.
How does the US market differ from the global average?
AI illustration · Tech World News
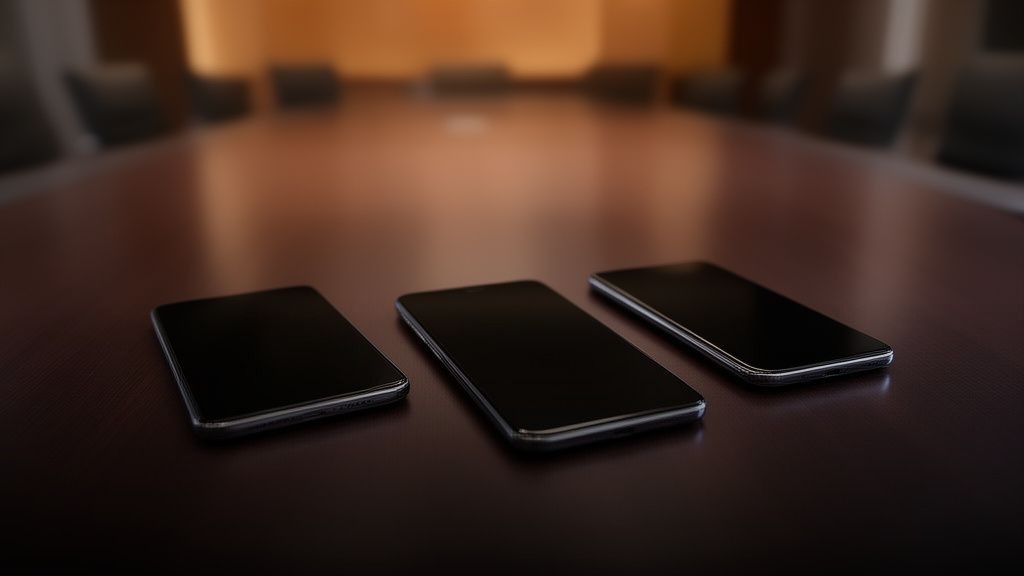
The United States represents a distinct outlier in the global smartphone market share by brand, characterized by an overwhelming preference for Apple.
Data from BankMyCell indicates that the US market is dominated by Apple and Samsung, with 55.91% and 29.87% share respectively. When combined, these two brands control nearly 86% of the US market, leaving minimal room for other global players like Xiaomi or Oppo.
Furthermore, Statista reports that Apple and Samsung not only lead the smartphone market in the United States in terms of usage but also in terms of customer satisfaction. This high satisfaction rate correlates with longer device retention cycles in the US compared to emerging markets, where consumers may upgrade more frequently due to lower average selling prices and different financing structures.
For global businesses, this means that a US-based enterprise fleet will almost exclusively consist of iOS and Samsung Android devices, simplifying Mobile Device Management (MDM) but increasing per-unit procurement costs.
What do these market shifts mean for enterprise IT and device management?
For business owners, IT decision-makers, and procurement managers, the shifting smartphone market share by brand is not just a consumer trend; it directly impacts enterprise mobility strategies, total cost of ownership (TCO), and security postures.
1. The Premiumization of Corporate Fleets
The accelerating premiumization trend means that the baseline cost for enterprise smartphones is rising. As IDC’s Francisco Jeronimo noted, “The second quarter of 2026 brought a widening gap between the top and bottom of the market. Samsung and Apple both grew shipments and widened their lead, lifting their share by 3.2 and 3.9 percentage points, respectively.” Because memory crises and supply chain disruptions disproportionately punish low-end vendors, IT departments can no longer rely on cheap, high-volume budget devices for field workers. Procurement budgets must be adjusted to accommodate higher average selling prices for durable, premium devices that receive longer software support.
2. Mobile Device Management (MDM) Consolidation
With Apple securing a record 22% annual share projection for 2026 and dominating the US market, enterprise IT teams are seeing a natural consolidation toward iOS in corporate environments. iOS’s closed ecosystem simplifies MDM deployment, security patching, and app distribution. However, for global organizations operating in regions where Android holds 70%+ share, IT leaders must maintain robust Android Enterprise management protocols to handle device fragmentation across Samsung, Xiaomi, and other vendors.
3. Supply Chain Resilience and Procurement Timing
The 2026 memory crisis highlights a critical vulnerability in hardware procurement. Consumers and businesses are anticipating upcoming price hikes, leading to accelerated pull-in demand. IT decision-makers should lock in enterprise agreements and secure hardware allocations well in advance of major product cycles to avoid spot-market price surges and stockouts.
Frequently asked questions
Which brand has the largest smartphone market share worldwide?
Apple holds the largest global usage share at 30.65% and led global shipments for the third consecutive year in 2025. Samsung is the second-largest brand globally, with a 23.47% usage share and a 19% shipment share in Q3 2025.
What is the global market share of Android vs iOS?
Android maintains commanding market leadership, capturing between 71% and 73.5% of the global market share in 2025. iOS holds the remaining share, driven by premium device sales primarily in North America, Europe, and parts of Asia.
How has the memory crisis affected smartphone shipments in 2026?
The memory crisis caused global smartphone shipments to shrink 7.4% year-over-year in Q2 2026. It disproportionately impacted low-end vendors, as memory costs accounted for over 65% of the bill of materials at the low end, favoring premium players like Apple and Samsung who secured supply early.
What is the smartphone market share in the United States?
The US market is heavily concentrated, with Apple holding a 55.91% share and Samsung holding a 29.87% share. Together, they account for nearly 86% of all smartphone usage and sales in the country.
Related articles
- Apple Expands Siri AI Language Support in iOS 27.2 for Global Business Users
- HARMAN and Samsung Mark 10 Years as AI-Driven Intelligent Audio Takes Shape for Enterprise Spaces
- Samsung Expands Consumer SSD Campaign While Unveiling 256TB Enterprise Drives for AI
Reviewed by Shahid Anwer · Editorial standards